

Next: Get Coordinates by Cursor
Up: 5.2 Tasks of the
Previous: Label Source List Positions
The command to draw a coordinate line into the overlay channel of the
image is
DRAW/COORDINATES line isoline [equinox] [text_flag] [table_flag]} [color] -
                 [displ]
- isoline is the specification of the coordinate line
to be drawn. Examples are RA=120.4, DEC=-70.4,
LAMB=20.3, BET=-4.2, LII=0.2,
BII=14.4, RA=12,30,00, DEC=-10,10,30.
RA and DEC specify right ascension and declination in degrees
(or h,m,s and d,m,s), LAMB and BET ecliptic longitude and latitude
in degrees (or d,m,s), LII and BII galactic longitude and latitude
in degrees (or d,m,s).
- equinox is the equinox for which the coordinate is specified.
The default is 2000.
- text_flag is a display flag, text_flag=1 means
to display the coordinate specification as given in the input,
text_flag=2 means to display the coordinate specification
in units of hours,minutes,seconds in case of right ascension
and in units of degrees,minutes,seconds in case of declination.
text_flag=0 means to display no coordinate specification.
The default is text_flag=1.
- table_flag is a table output flag.
If set to 0, no output is written,
if set to 1, the table name will be the value of isoline,
else the table name is the value of table_flag.
The x,y-coordinate is written in sky pixels to the columns
:X_SKY and :Y_SKY.
The default is 0, no table output.
- color is the color of the coordinate line. The allowed values
are white, yellow, green, red, blue, cyan, magenta, backg, and black.
- displ is a display flag.
If set to displ, the coordinate line will be drawn to
the overlay channel 0. If no image is loaded,
the name of the image has to be specified with this parameter.
This is only necessary in case of table output flag setting.
The default is displ.
Examples are:
DRAW/COORDINATES line RA=85.0
DRAW/COORDINATES line DEC=-70.0
DRAW/COORDINATES line LII=280.0
DRAW/COORDINATES line BII=-31.5
DRAW/COORDINATES line DEC=-69.0 2000.0 0
DRAW/COORDINATES line RA=85.0   2000.0 2
DRAW/COORDINATES line RA=85.0   2000.0 0 1
DRAW/COORDINATES line RA=120.4 ? ? ? green
DRAW/COORDINATES line RA=120.4 ? ? coord ? image1
Figure 5.11:
Coordinate grids drawn with the command DRAW/COORD line
for the equatorial coordinate system.
Figure 5.12:
Coordinate grids drawn with the command DRAW/COORD line
for the galactic coordinate system.
The command to draw a polygone into the overlay channel is
DRAW/COORDINATES polygon [parfil] [edit]
- parfil is the name of the parameter file.
If the file is not found in the current directory, then it will
be created by the command CREATE/PARFIL POLY polygo.par.
- edit is a parameter file edit flag (edit or
noedit). The default is noedit.
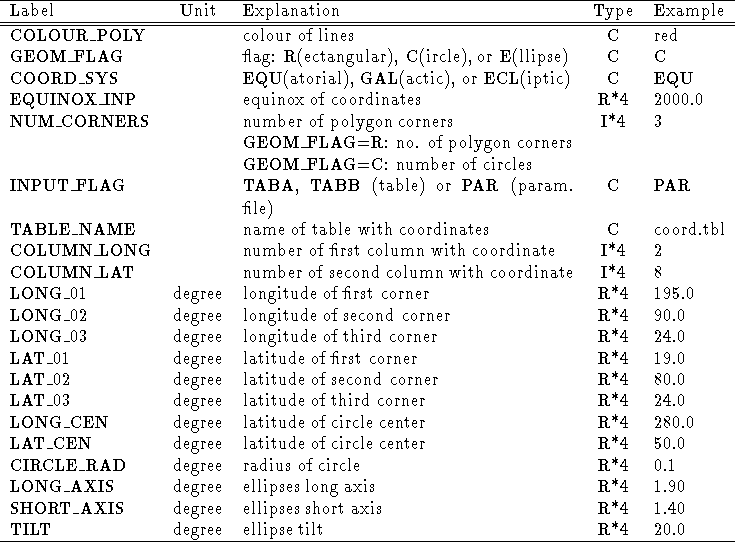
The parameter file has to be filled. The parameters listed in
Table 5.25
have to be specified.

Table 5.25: Parameters for command DRAW/COORD polygone
The command to overplot a coordinate frame is
OVERPLOT/COORDINATE frame_tab RA_axes DEC_axes -
                    ref_image tics [equinox]
- frame_tab is the name of the table created containing the
RA, DEC points of the polygone specifying the frame (including
the tic-marks). A table pix_'frame_tab' is created containing the
sky pixel coordinates of the polygone.
- RA_axes is the specification of the right ascension axes as
RA_start,RA_end,RA_step where RA_start is the
start value of right ascension (degree), RA_end is the end
value of right ascension (degree) and RA_step is the step
size of right ascension (degree).
- DEC_axes is the specification of the declination axes as
DEC_start,DEC_end,DEC_step where DEC_start is the
start value of declination (degree), DEC_end is the end
value of declination (degree) and DEC_step is the step
size of declination (degree).
- ref_image is the name of the reference image containing the
general EXSAS header descriptors to convert equatorial coordinates
to sky pixel coordinates.
- tics is the relative length of tic-marks in RA, DEC direction
compared to RA_STEP and DEC_STEP. For tics=0,0
no tic-marks are plotted.
- equinox is the equinox for which the right ascension and declination
is specified, the default is 2000.0.
Examples are:
OVERPLOT/COORDINATE frame  10.,12.,.5  -20,-10.,1. image1  .1,.1
OVERPLOT/COORDINATE frame  8.,9.,.25    70.,80.,1. image1  .1,.1  1950.0
OVERPLOT/COORDINATE frame  10.,12.,.5  -20,-20.,1. image1  0,0
OVERPLOT/COORDINATE frame  10.,10.,.5  -20,-10.,1. image1  0,0
In the last two examples coordinate lines (without tic-marks) are
plotted for constant declination and right ascension, respectively.
This command can be used in case a plot (contour plot,
source position plot or any other plot in the x,y sky pixel
coordinate system) has been done before.
The plot works properly only in case the plot settings
SET/GRAP STYPE=0 LTYPE=1
have been done before and the specified frame lies within
the plotted range of data. No labels and numbers are plotted.
A plot setting
SET/GRAP PMODE=0
is recommended to have only the equatorial coordinate frame plotted
(and not also the sky pixel frame).


Next: Get Coordinates by Cursor
Up: 5.2 Tasks of the
Previous: Label Source List Positions
If you have problems/suggestions please send mail to
rosat_svc@mpe-garching.mpg.de

