This topic discusses the recommended methodology for gathering performance data, which used the beginning of the optimization process. When attempting to identify performance issues, move through the following general phases in the order presented:
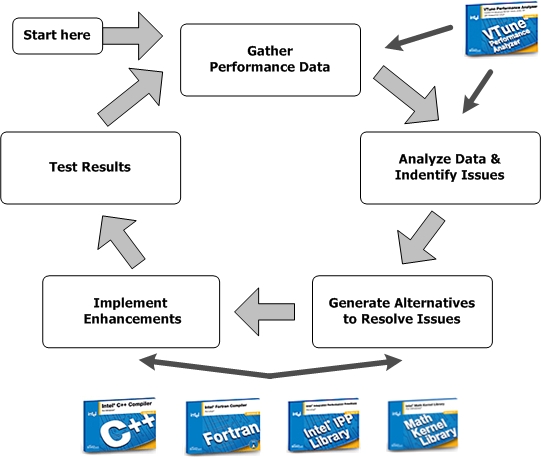
The performance methodology phase relationships are shown in the following figure.
The following sections discuss each of these stages in more detail.
In this phase, do not guess where performance bottlenecks occur; instead, use tools to measure the bottlenecks. Using the right tools for analysis provides an objective data set and baseline criteria to measure implementation changes and improvements introduced in the other stages. The VTune™ Performance Analyzer is one tool that you can use to gather performance data and quickly identify areas where your code runs slowly, executes infrequently (hotspots), or executes too frequently (when measured as a percentage of time taken against the total code execution).
See Using Intel Performance Analysis Tools and Using Tuning Tools and Strategies for more information about some tools and strategies you can use to gather performance data.
In this phase, use the VTune™ Performance Analyzer analysis to discover where to concentrate your effort to improve performance. With this tool you can identify the most significant performance issues and solutions.
It is important to limit the scope of analysis. Pick one item at a time identified by the VTune™ Performance Analyzer, and work to resolve that one performance issue.
During this phase, concentrate on generating alternatives and identifying tools and strategies to help resolve the issues discovered during the previous phases. For example, you can use compiler optimizations, bring in Intel® Performance Library routines, or use some other optimization (like improved memory access patterns, reducing or eliminating division or other floating-point operations, recoding with intrinsic or assembly code, or other strategies).
While optimizing for the compiler and source levels, use the following strategies:
First, use available supported compiler switches. This is the most portable, least intrusive compiler and source optimization strategy.
Second, use compiler directives embedded in the source. This strategy is not overly intrusive since the method involves including a single line in code, which can be ignored (optionally) by the compiler.
Third, attempt manual optimizations. The preferred strategy within optimization is to use available compiler intrinsics.
Intrinsics are usually small single-purpose built-in library routines whose function names usually start with an under-bar (_), such as the __mm_prefetch intrinsic.
If intrinsics are not available, try to manually apply the optimization. Manual optimizations, both high-level language and assembly, are more labor intensive, more prone to error, less portable, and more likely to interfere with future compiler optimizations that become available.
During this phase, use the tools and strategies identified in the previous phases. The easiest enhancements will probably involve enabling common compiler optimizations for easy gains. Additionally, you might want to implement Intel® Performance Library routines that may require some interface coding.
During this phase, determine whether or not the enhancements helped. However, you must have a consistent, reliable test that reports a quantifiable item such as seconds elapsed, frames per second, and so forth, to be able determine if the implementation changes have actually helped performance.
Make small changes and measure often. Have a target performance level in mind so that you know when you have reached an acceptable gain in performance. Remember, there is no such thing as the fastest code.
If you approach a point of diminishing returns and you have no other identified performance issues, stop optimizing.
If you think you can make significant improvement gains or you still have other performance issues to address, repeat the steps in the first phase: gather performance data.